News
Knowledge Graph Conference 2023
Richard Loveday will be speaking at the Knowledge Graph Conference 2023 in May at Cornell Tech in NYC. In the talk he will demo Graph.Build's...
This step by step guide shows you how to build a knowledge graph. It covers the traditional way and the new, automated way. Use new technology for speed.
Creating and maintaining a knowledge graph is a complex task that has, until recently, required not only a deep understanding of both the domain and the technology involved but also deep pockets, a lot of time and teams of not only data scientists but also software engineers and database experts. Despite the challenges that have persisted until now, knowledge graphs have become a popular tool for organisations seeking to gain insights into their data and improve decision-making. Knowledge graphs allow companies to represent their data in a more meaningful way, capturing the relationships between various entities and attributes. This enables them to uncover hidden patterns, relationships, and insights that would be difficult to identify using traditional data analysis methods. Additionally, knowledge graphs can enhance search functionality, allowing users to find relevant information quickly and easily. To date, this technology has been widely adopted in industries such as healthcare and finance, where quick and accurate decision-making is critical.
While the benefits of using a knowledge graph to represent data are clear, the road to creating a functional one has traditionally been full of obstacles that require expertise and patience, but it doesn’t need to be like this.
Before explaining the way to create a knowledge graph in an efficient, scalable manor for companies of all sizes, it is important to understand how Knowledge graphs have typically been created to date which is explained in the following steps.
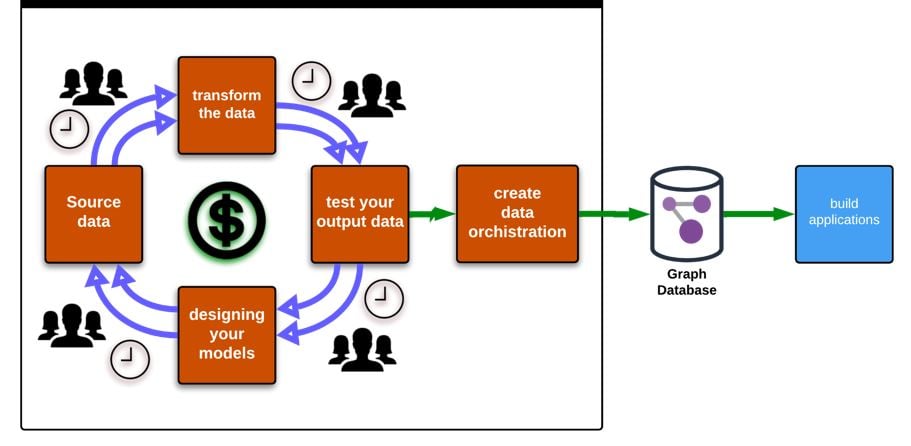
The first step in creating a knowledge graph is transforming the data into a graph format, which involves using graph databases such as Neo4j or Amazon Neptune, as well as expertise in data modelling and graph schema design. The schema design stage is particularly crucial, as it involves specifying the types of entities, attributes, and relationships that will be included in the graph. This requires expertise in data modelling and schema design, as well as knowledge of graph query languages such as SPARQL or Cypher.
Loading data into the knowledge graph is a complex process that requires knowledge of ETL (extract, transform, load) processes and the tools used to execute them. Identifying the relationships between various entities and creating links between them is a task that requires expertise in graph traversal algorithms and graph query languages such as SPARQL and Cypher as well as software development.
Enriching the data involves adding additional attributes and metadata, such as timestamps, geospatial data, and sentiment analysis, to provide additional insights into the data. This step requires expertise in data enrichment techniques, such as natural language processing and machine learning.
Testing the knowledge graph for suitability is a critical step in the process. Running trial queries and checking how long they take to run is necessary to ensure that the knowledge graph meets the needs of the application it will be used for. If any aspect of the test fails, the previous steps must be repeated.
Making changes to the knowledge graph is not a simple task and requires repeating the previous six steps. The difficulties inherent in this process cannot be overstated and require a high degree of expertise and rigour in order to ensure that the resulting graph has gone through the proper development stages.
As you will have gathered from the description above, creating a knowledge graph has, historically, required software engineering, to bring data into the proposed graph model, to test it and then to write it to a suitable graph database. If it works perfectly the first time and needs no future changes, it is still an expensive and time-consuming operation, but this is the best case and doesn’t happen in practice. Graph models need to be tested and perfected multiple times and even following deployment, a programme of optimisation is desirable but the ability to react to change quickly is critical. This just isn’t possible using the old method.
Companies who have attempted to build software to bring data in and publish it to graph databases have often found themselves hemmed in by design decisions made early in a dynamic market and beholden to the availability of specialist software development teams to maintain and update the software. They have significant opportunity costs due to the lack of pace they can adapt with as well as immediate financial costs required to adapt. In addition, they are often stuck with particular technology stacks, such as one graph database provider, because the software was written for a specific solution at a particular point in time. The reason they have attempted this is because there has not been a suitable platform to build these solutions on, that replaces the need for expensive and slow software development work, until now.
The new way of creating knowledge graphs is to allow data scientists the freedom and head space they need to develop and experiment with graph models, the capability to share them visually and make changes quickly without the need for software engineering to bring data in or to write it into a database. Furthermore, this task requires no coding expertise allowing for resources to be focussed in the right places and for businesses to experiment, test, deploy and adapt quickly.
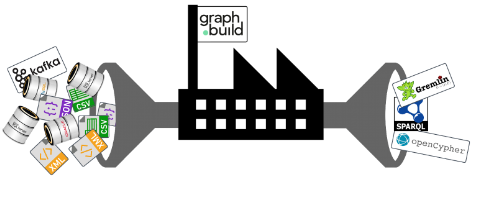
This can be achieved using the Graph.Build platform, launched in 2023 as follows:
Step 1: Easily connect your data source by specifying its location in the simple configuration and telling the tool what type of data it is (anything from a flat file like XML to a SQL database).
Step 2: Choose from one of the widely used schemas in the platform’s library or specify your own. This will govern the model for all team members who use it.
Step 3: Use the simple drag and drop user interface to create entities and the links between them. You can then see your model representation as you’re building it, share it and collaborate on it.
Step 4: Test as you go, without any delay, coding or deployment.
Step 5: Specify which graph database you are using or publish it to a bucket. It doesn’t matter if you use Amazon Neptune, Neo4J or any other graph database, just set the right one and hit publish.
Now, when changes are required in the future because of environmental changes, commercial reasons or optimisation, you just need to change some settings in the simple steps above. You can do the same if you need to prove a concept quickly.
In conclusion, the technology barrier to using knowledge graphs has largely been removed. Data Scientists can do what they do best, creating Knowledge Graphs that solve challenges facing organisations and allowing for faster innovation at a larger scale. Now is the time to adopt this breakthrough technology.
Richard Loveday will be speaking at the Knowledge Graph Conference 2023 in May at Cornell Tech in NYC. In the talk he will demo Graph.Build's...
The Knowledge Graph Conference (KGC) is one of the highlights of the year for knowledge graph professionals. A chance to hear about the latest...
This is a step-by-step example of how to create a knowledge graph model, or any other graph model, using the Graph.Build no-code Studio solution.